This month sees the 200th anniversary of the birth of Dr John Snow and for anyone who has attended a Better Mapping seminar, the first map will be very familiar to you as it is used by Giles Darkes as part of his talk illustrating how you can present statistical data using maps.
 |
| http://en.wikipedia.org/wiki/John_Snow_(physician) |
Although he is better known as one of the founding fathers of modern epidemiology, Dr. John Snow produced this map of the area around the Broad Street pump to illustrate his hypothesis that cholera reproduced in the human body and was spread through contaminated water. This contradicted the prevailing theory that diseases were spread by "miasma" in the air. The September 1854 cholera outbreak was centred in the Soho district, close to Snow's house. Snow mapped the 13 public wells and all the known cholera deaths around Soho, and noted the spatial clustering of cases around one particular water pump. He examined water samples from various wells under a microscope, and confirmed the presence of an unknown bacterium in the Broad Street samples. Despite strong scepticism from the local authorities, he had the pump handle removed from the Broad Street pump and the outbreak quickly subsided. Snow subsequently published a map of the epidemic to support his theory.
In his talk Giles cleverly shows how the results can be ‘manipulated’ depending on how you categorise the data. If the area around the pump is partitioned in different ways, it can seriously skew the data and even suggest that the Broad Street pump is not necessarily the problem. A cautionary tale that is still valid today in reminding us that the aggregation and categorisation of data for portrayal graphically is vitally important to the message that we are trying to convey cartographically. Indeed, some anomalies are worth noting. Although the large workhouse just north of Broad Street housed over 500 paupers, it suffered very few cholera deaths because it had its own well (not shown on the map). The workers at the brewery one block east of the Broad Street pump could drink all the beer they wanted; the fermentation killed the cholera bacteria, and none of the brewery workers contracted cholera. Many of the deaths further away from the Broad Street pump were people who worked at the market on Broad Street and drank from that well.
For anyone wishing to find out more, there is an exhibition at the London School of Hygiene & Tropical Medicine, Keppel Street, London WC1E 7HT entitled ‘Cartographies of Life & Death – John Snow and Disease Mapping’. It opened on 15th March and runs until 17th April.
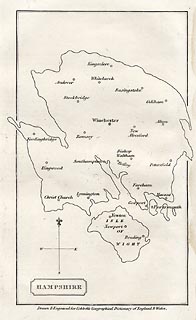
Our second anniversary this month is the 250th anniversary of the birth of William Cobbett, best known for his book Cobbett’s Rides, a topographical narrative of his travels around the south east of England still available in Penguin Classics form. The map I have chosen to illustrate this was published in A Geographical Dictionary of England and Wales, by Cobbett in 1832. The map shows an outline of Hampshire, in an almost unrecognisable shape - either a very strange projection or a bad map! The only features are the main towns.

What do the following have in common?
- Maps as music
- Edwardian transport planning
- Smells of Paris
- Pacman
- The map of 1000 cuts
- Maps in the media
- Word maps
We were treated to some very engaging talks from a range of speakers and it was noticeable that similar themes kept being picked out. The underlying theme was the sense of place and how we move from being in a ‘space’ to being in a ‘place’ by the things that we associate with it through a variety of senses.. We considered the associative elements of senses and what reminds us most of particular locations – think how often a smell can make you remember a particular place.
Looking ahead:
- If you haven’t yet booked for the talk by Michael Palin at the RGS on 12th April it’s not too late to do so. Entitled ‘A life in Maps’, it promises to be a fascinating evening from one of our ‘National Treasures’. Book your ticket now
- BCS will have a panel on the IMIA stand at the London Book Fair from 15th-17th April, so if you are attending, please make sure that you come and visit us to see the pre-publication details of the BCS 50th anniversary book. Due for publication later this year the book celebrates 50 years of the Society by selecting a UK event and world event from each year and illustrating it with an appropriate map.
Pre-publication price will be £12.50, so keep an eye on the website in the near future for details.
26th March 2013


No comments:
Post a Comment